data visualization
I use code to create colorful, data-driven visual stories.
Inspired by art and design, I embrace the power of data visualization to produce clean infographics and functional representations of complex systems. My expertise includes computational programming and creative tools like Gephi and Adobe Creative Suite to design compelling graphics. I pay special attention to color and clarity—including the use of color-blind-friendly palettes—crafting visuals that balance scientific precision with aesthetic impact.
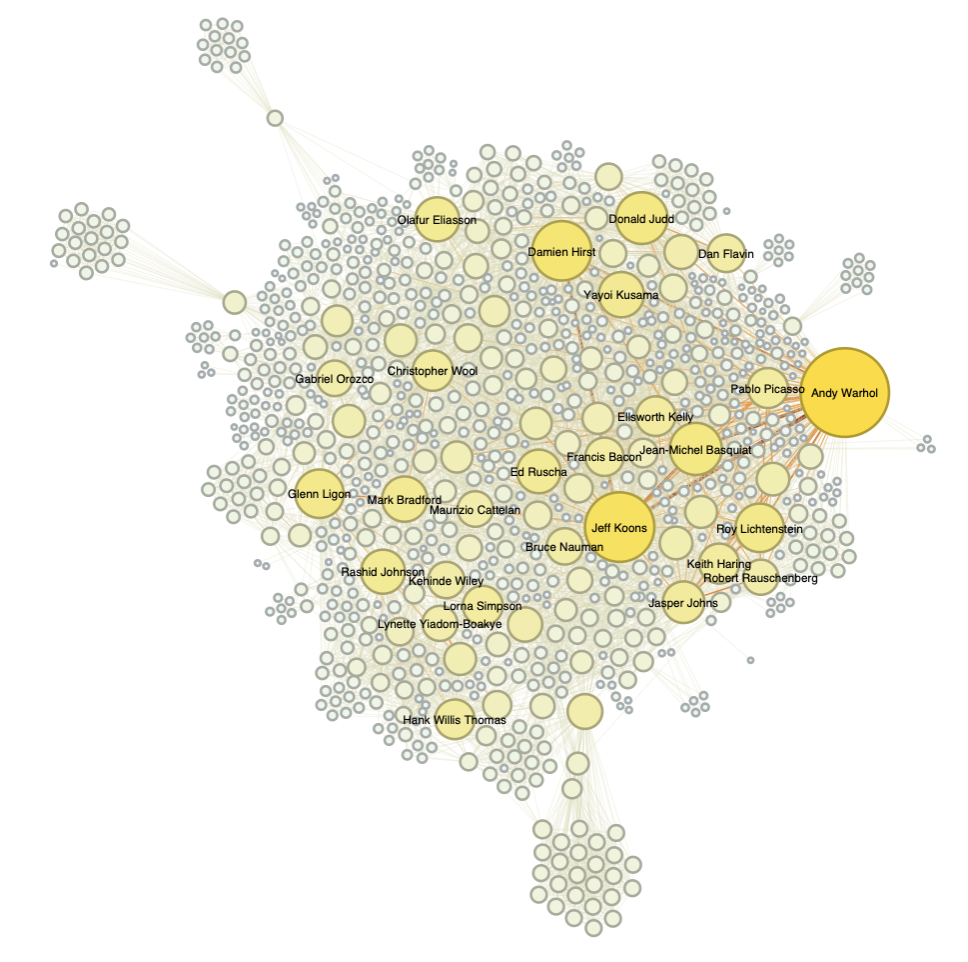
Network of Material Colors
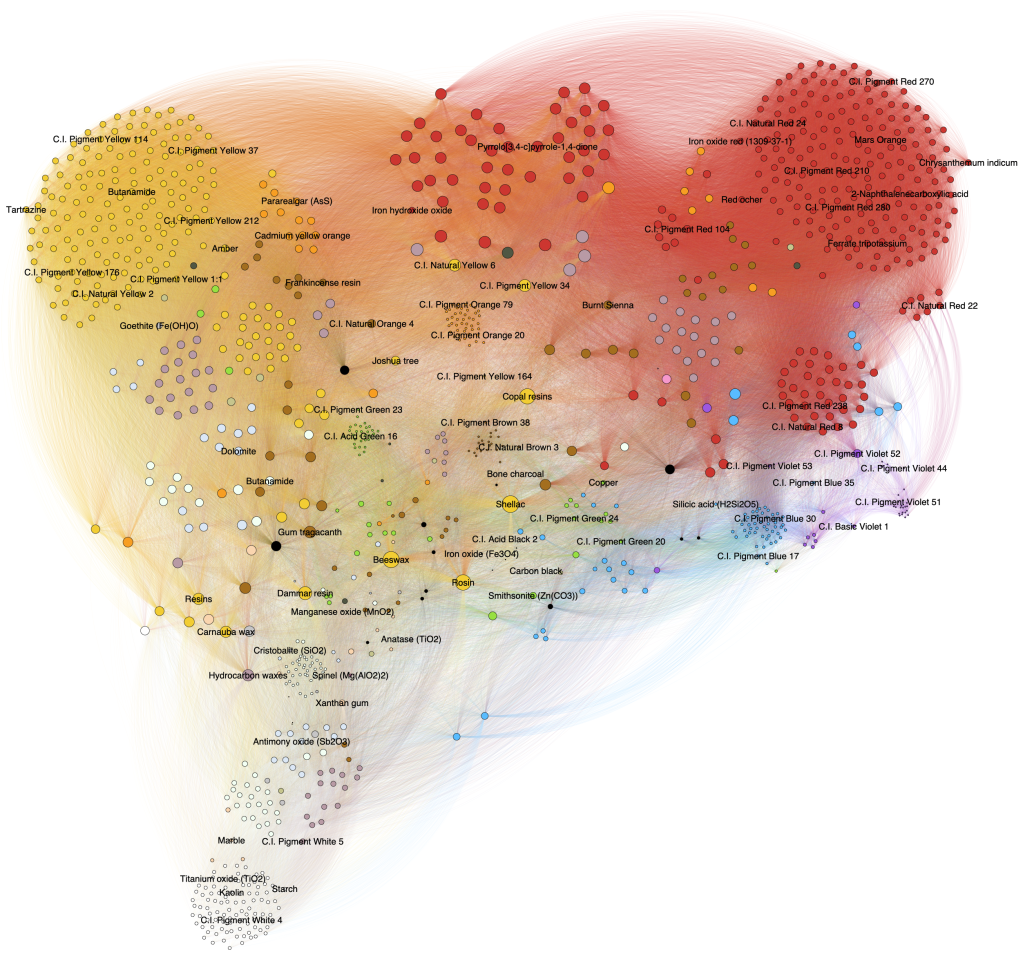
This network connects materials in the IRUG spectral database based on shared display color. Each material is a node, and links form between nodes that share the same visible color. Node color reflects the material’s actual appearance. By clustering materials through visual similarity, the network uncovers hidden relationships across substances used in art and cultural heritage.
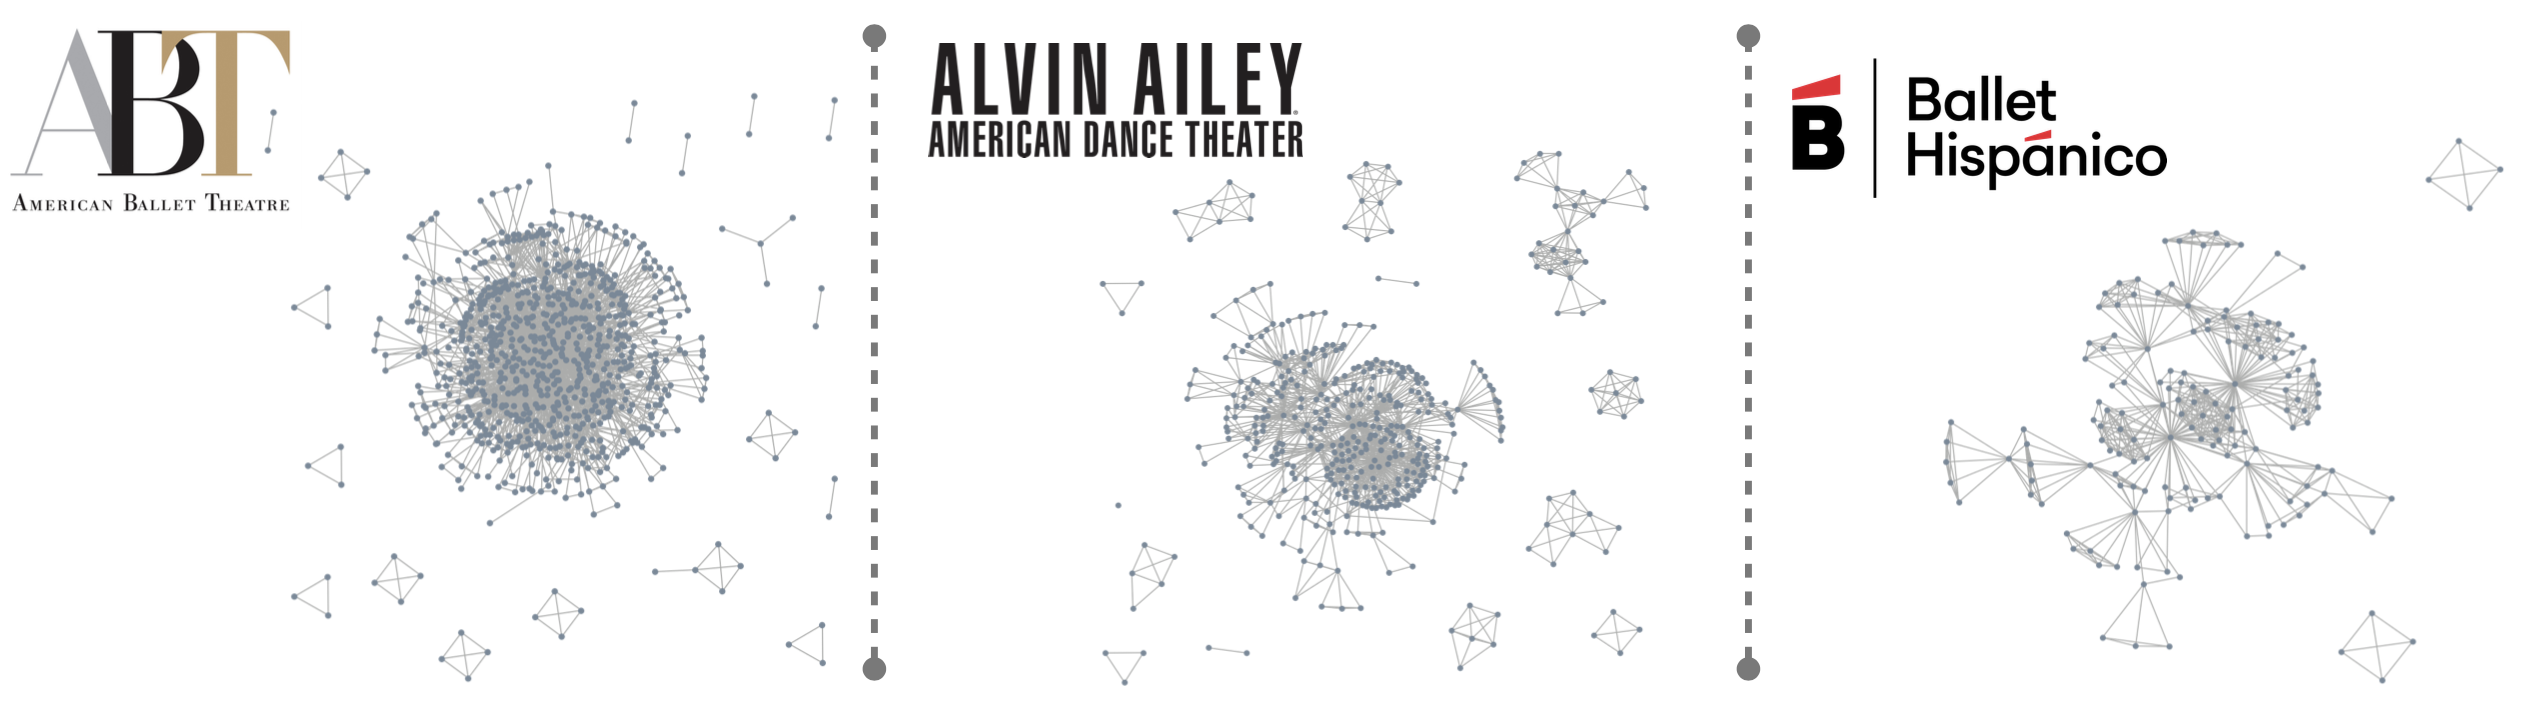
Swan Lake Network
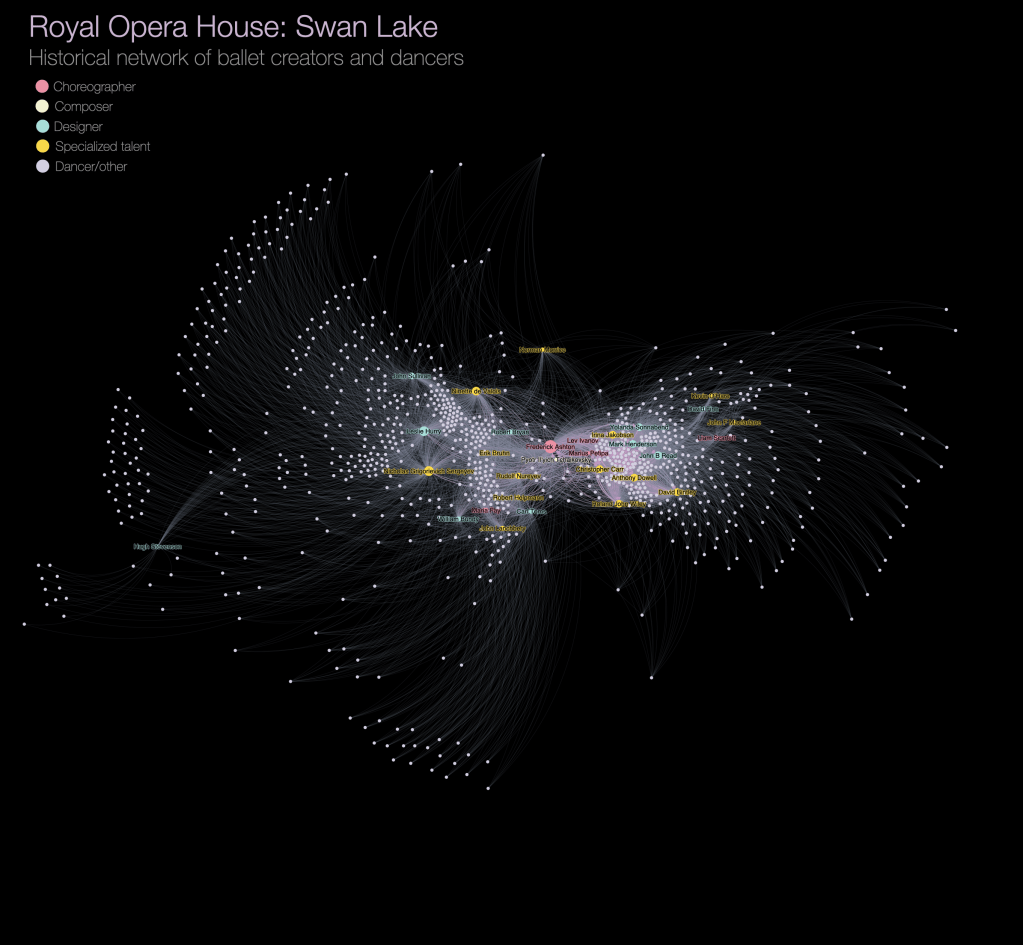
This project uses large-scale performance data and network science to explore the collaborative dynamics and creative hierarchies behind Swan Lake productions at the Royal Opera House. By connecting dancers, choreographers, designers, and composers, the network helps reveal how ballet professionals work together to bring this iconic production to life.
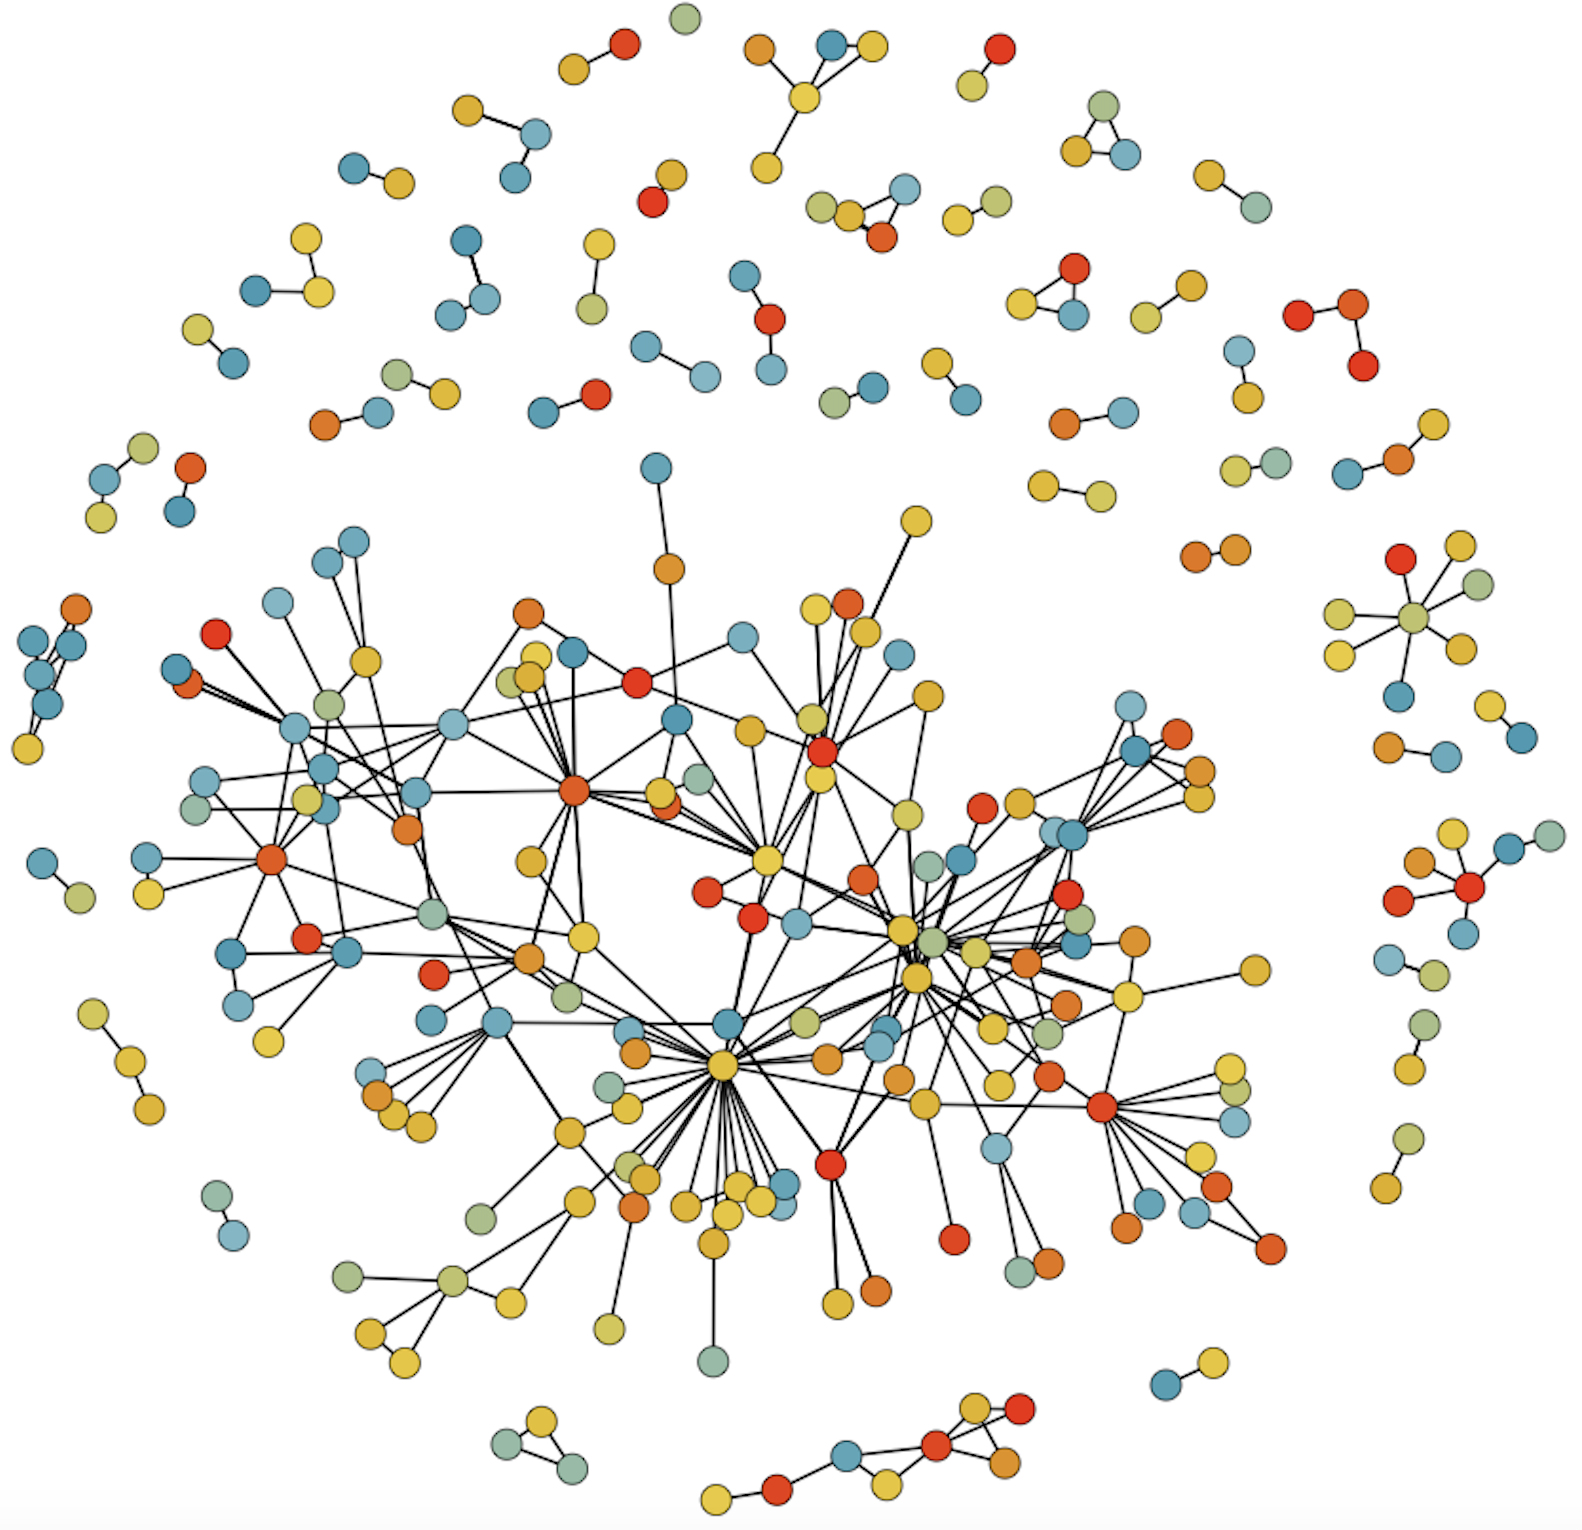
Women In Ballet
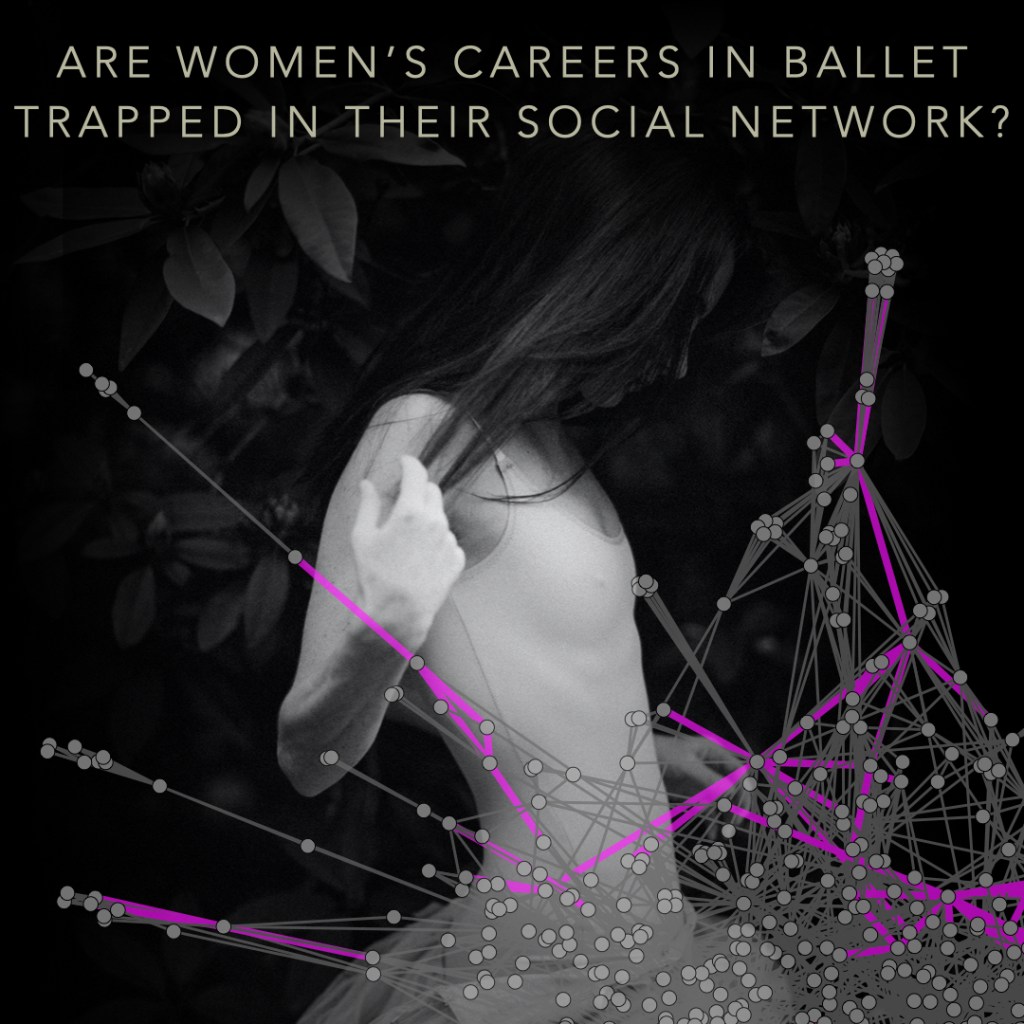
This data visualization project shows the collaboration network of ballet creations at the New York City Ballet. Using repertory data and network science, this visualization highlights the gender of the artists holding central roles in creative collaborations, and raises questions about women’s representation in the leadership world of ballet.
Data Stories
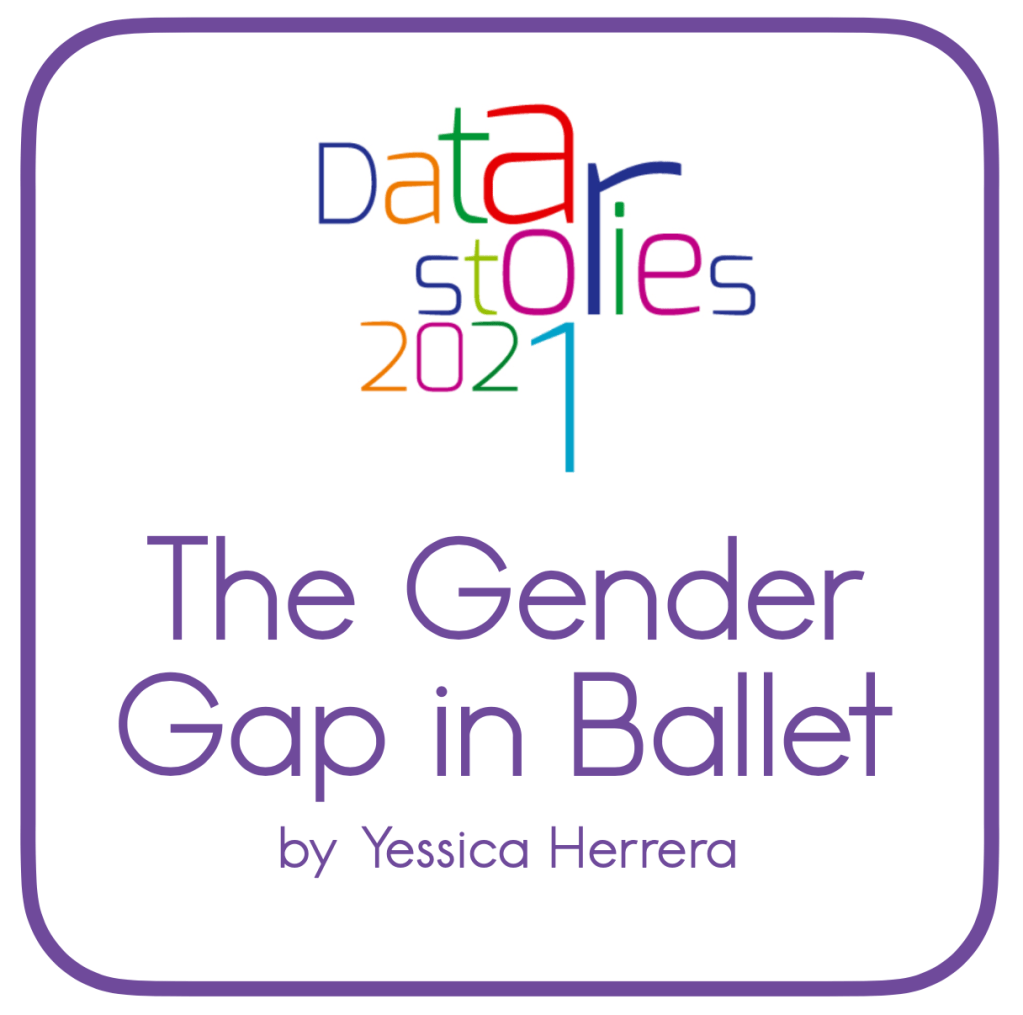
Two original data visualizations created for the Data Stories exhibition at Central European University in 2020 and 2021. Through the lens of network science and open data, I explored themes of leadership and gender inequality in ballet creation. The first story focuses on a unique creative process of transforming structured data into a clear and visually engaging story. The second story drew inspiration from the Information is Beautiful workshop and applied a concept-driven approach to design.
other projects